
A3M Global Monitoring
- Select menu item "A3M Global Monitoring"
- Integrated online help for A3M Global Monitoring
- Basic knowledge for an easy start with A3M Global Monitoring
- The multifunctional tool in A3M Global Monitoring
- Detailed information on a specific location
- Search for a specific location on the world map
- Select map type
- Filters and settings
- Configuring the map
- “External information” filter
- Events filter
- Filter area “Event / relevance level”
- “Time filter mode” filter area
- “Time range” filter area
- “Internal information” filter
- Tickers
- Event ticker
- “Travel Advice AA” ticker
A3M Global Monitoring is a web-based travel risk, information and management system that provides round-the-clock overviews of current threats around the world.
The central feature of the function is the world map, which displays georeferenced information (warnings, threats, critical weather conditions etc.) in the form of icons at the corresponding locations.
Use the filter function to the left of the map to customise the display of events and information to suit your personal needs and requirements.
A window to the right of the map displays the latest news about events worldwide.
All information in A3M Global Monitoring is automatically updated at regular intervals, keeping you permanently up to date with developments.
For details of A3M Global Monitoring, go to https://www.fact24.com/en/areas-of-application/travel-safety/
Select menu item "A3M Global Monitoring"
A3M Global Monitoring is optimised on an ongoing basis. Further functions will be added to the program successively and can be used in later program versions. The tool is currently available in two languages, German and English.
You can pre-select the language in which you wish to activate the tool. To open the tool, click Global Monitoring in the menu on the left.
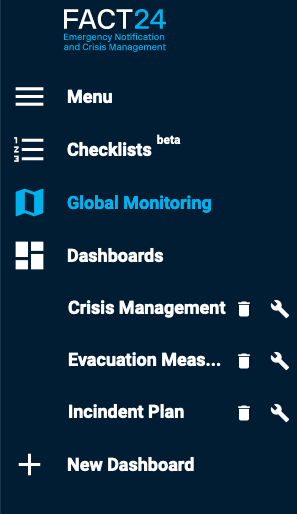
Fig.: “A3M Global Monitoring” menu item
Integrated online help for A3M Global Monitoring
A3M Global Monitoring includes a detailed online help entry containing information on the functions and use of the tool.
To open the online help, at the top right of the page click Help, then Global Monitoring Help.
Fig.: Integrated online help for A3M Global Monitoring
The online help entry opens in a separate tab. It is displayed in German or English, in line with the language version of A3M Global Monitoring activated for your use.
Basic knowledge for an easy start with A3M Global Monitoring
All you need to start working with A3M Global Monitoring is some basic knowledge.
The following sections describe this basic knowledge as an easy way to get you started in the world of A3M Global Monitoring.
A3M Global Monitoring also contains more advanced functions to support you in your daily use of the tool.
For more detailed information on all relevant topics related to the use and functions of A3M Global Monitoring, see the integrated online help entry (see Integrated online help for A3M Global Monitoring).
The multifunctional tool in A3M Global Monitoring
The world map is the main element of A3M Global Monitoring. The multifunctional tool is the most important tool for using this map.

The multifunctional tool is located above the world map on the left of the toolbar, together with further tools (icons) which you can use to customise your map view. The multifunctional tool is activated as default (highlighted button).

Fig.: Toolbar
You can use the activated multifunctional tool to perform the following standard functions:
- Navigate around the world map: Click and hold the left mouse button (drag and drop) to move the map in the desired direction. Double-click to zoom into the map,
- Display information about events on the world map: Each icon shown on the world map represents an event. To view more detailed information about an event, click the corresponding icon (see Open detailed information about a specific location).
Detailed information on a specific location
Each icon shown on the world map represents an event. The shape and colour of an icon corresponds to the type of event (see filter function “Event level / Relevance level”). Click an icon to display relevant information about the corresponding event. Information primarily involves warnings, threats, safety and weather reports, etc.
Example: You are interested in the current travel safety situation in Tunisia and want relevant information.
The world map currently shows two event icons for Tunisia.
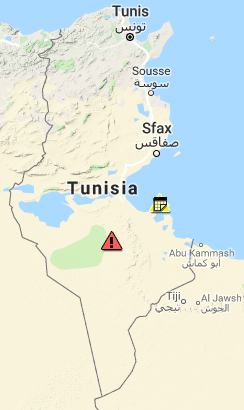
Fig.: Zoomed world map view - Tunisia
Click the desired icon to display detailed information.
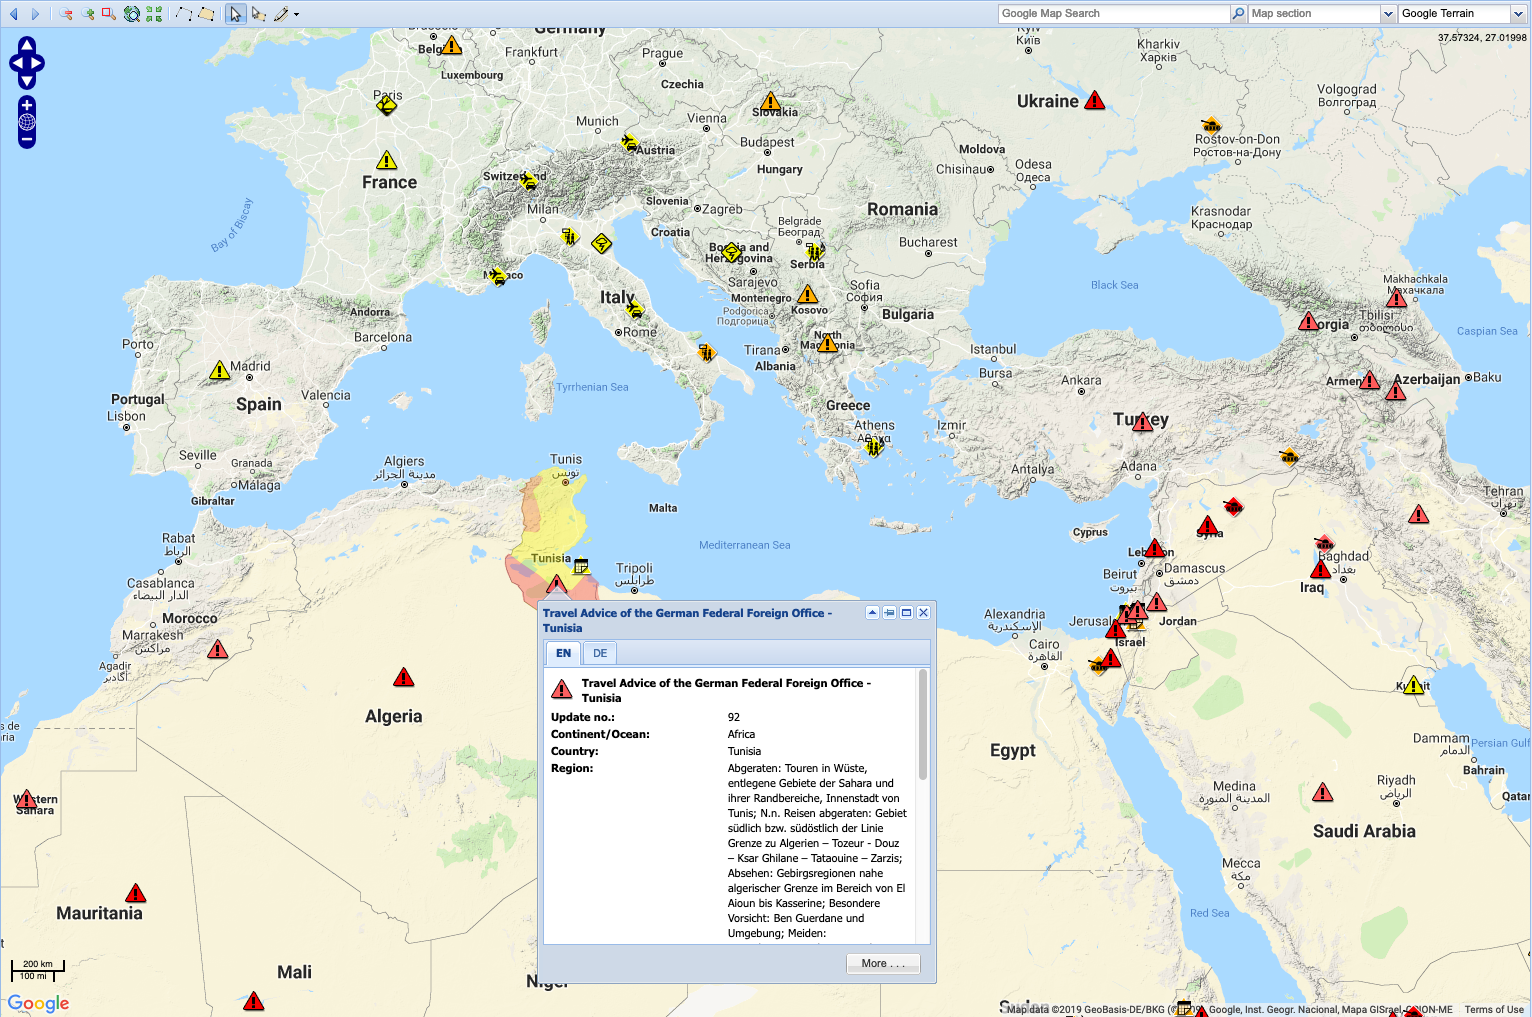
Fig.: Opened pop-up window with event information
A pop-up window opens displaying the required information. The relevant country is highlighted on the map, with the highlight colours representing the various danger zones.
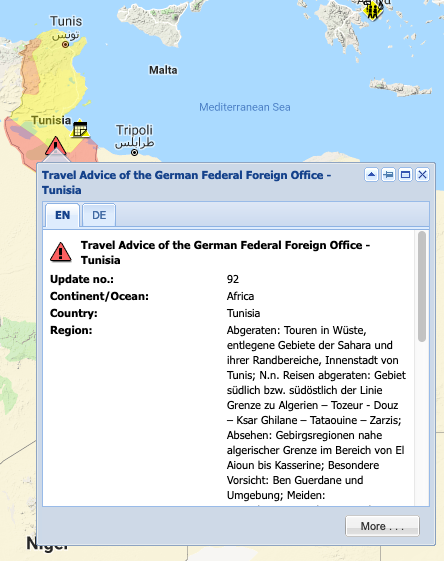
Fig.: Information in German and English
Use the EN and DE tabs at the top right of the pop-up window to choose English or German as the display language for the information. Click "More" to show further relevant information.
Search for a specific location on the world map
You can use the search function on the right of the toolbar to search for a specific location.

Fig.: Input fields with search and map options
The tool offers the following search functions:
General search function
This search field enables you to search by country or city name. Enter the name of the desired country or city in the field to the left of the Search icon (magnifying glass symbol).
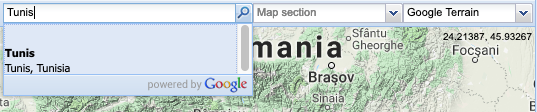
Fig.: Search by country or city name
When you enter your search term, a dropdown list of search hits opens. Click to select the desired location and display it on the map.
“Map section” search function
This search field enables you to search by country or region name. Enter the name of the desired country or region in the search field.
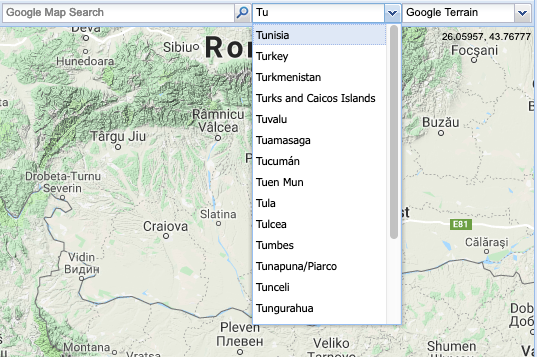
Fig.: Search by country or region name
The search results auto-complete to display options as you type. Click to select the correct place from the dropdown list of options and display the selected location on the map.
Alternatively, click the arrow on the right of the entry field to open a list of entries. Use the mouse to scroll down the list and click to select the desired entry.
Select map type
You can change the map view at any time. To do so, click the arrow on the right of the field showing the last selected map type (on the far right above the map). A dropdown list of map types appears. Click to select the desired map type. The map view changes automatically.
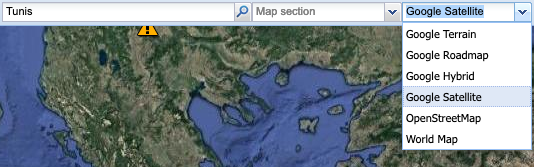
Fig.: List of map types
The following map type options are available:
- Google Terrain (default)
- Google Roadmap
- Google Hybrid
- Google Satellite
- OpenStreetMap
- World Map
Filters and settings
You can customise the event information display configuration using the filters and tickers on the left and right of the map. You can also activate or deactivate the display of additional event information.
For details of how to configure the individual filters and tickers, see the online help entry for A3M Global Monitoring (section: Integrated online help for A3M Global Monitoring)
Configuring the map
You can use the filters on the left of the world map to select the type of information you wish to display on the map.
The following filter options are available:
- External information
- Events filter
- Internal information
You can activate and deactivate various information categories, display events within a specific time range, display additional information, display internal data on the map (if saved as georeferenced data), etc. The following sections explain the available filters in more detail.
“External information” filter
This filter can be used to display various information provided by A3M Global Monitoring on the map, such as information about weather conditions, environment, political and security situation, airports, Foreign Office travel and safety advice, etc.
This information is classified in various categories.
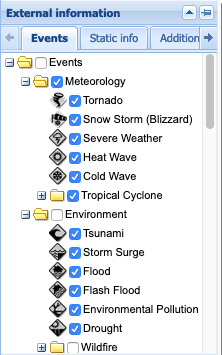
Fig. 77: “External information” filter
The categories can be found under the tabs:
- Events
- Static info
- Additional info
Each category has its own icon. Check the box to the left of a category name to select that category and display its information on the map.
Events filter
The “Events” filter allows you to define specific criteria for displaying event information on the world map. The filter has three criteria:
- "Event / relevance level" filter area
- "Time filter mode" filter area
- "Time range" filter area
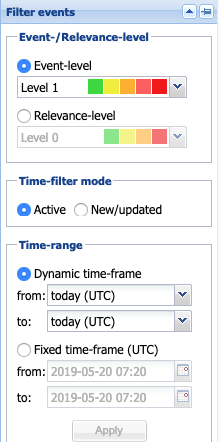
Fig.: Events filter
Filter area “Event / relevance level”
Events are displayed on the world map as icons in different colours. You can display events (icons) on the map by criticality or relevance level. These criteria are subdivided into various levels.
In the “Event / relevance level” filter area, first select Event level or Relevance level. Now select the level of criticality or relevance. Depending on your selections, events (icons) are displayed in various colours on the map.
Event level:
Click the round selection button next to the Event level heading to display events on the map by their level of criticality.
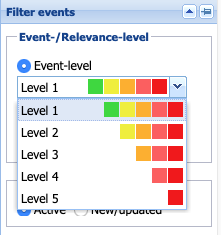
Fig.: “Event level” filter area
Then click the downward arrow at the right of the level bar. A pull-down menu opens showing the various levels. Each level is shown as a colour scale in which each colour stands for a different level of criticality.
Click to select the desired event level (criticality level).
Key to colours:
- Green: Note / information or all-clear. Safety relevance of event: none
- Yellow: Safety relevance of event: low / Little or no effect on infrastructure
- Orange: Event is safety relevant / Infrastructure is affected
- Red: Safety relevance of event: high / Infrastructure is significantly affected
- Dark red: Highest level of safety relevance / Infrastructure largely at a standstill
Relevance level:
Click the round selection button next to the Relevance level heading to display events on the map by their level of relevance.
Relevance can only be calculated if your target areas, hotels or bookings have been saved in the system.
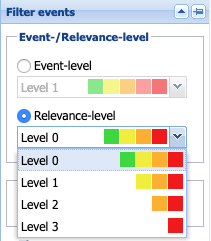
Fig.: “Relevance” filter area
Then click the downward arrow at the right of the level bar. A pull-down menu opens showing the various levels. Each level is shown as a colour scale in which each colour stands for a different level of relevance.
Click to select the desired relevance level.
Key to colours:
- Green: Relevance: none / not affected
- Yellow: Relevance: low / indirectly affected
- Orange: Relevance: medium / somewhat affected
- Red: Relevance: high / directly affected
“Time filter mode” filter area
This filter enables you to display events on the map by the following criteria:
Active
Click the round selection button next to the Active heading to display events on the map which are active within the specified time range. Define the time range in the “Time range” filter (see “Time range” filter).
New/updated
Click the round selection button next to the New/updated heading to display only new events or events that have been updated in A3M within the time range you have defined in the “Time range” filter.
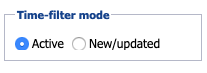
Fig.: “Time filter mode” filter area
Events displayed in line with the two criteria described above may be short-term or long-term events. Events such as an earthquake or accident are treated by the system as “short-term events” and usually appear on the map for a period of hours or days. However, German Foreign Office (AA) travel advice or industrial action are treated as “long-term events” that may be active for weeks or even months.
“Time range” filter area
Use the “Time range” filter area to specify the time range for the events you wish to view. The events are then displayed on the map. To ensure the latest information is displayed, the map information automatically updates every minute.
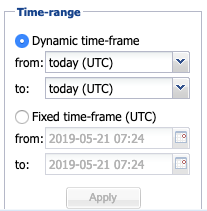
Fig.: “Time range” filter area
The following two options for selecting a time range are available:
- Dynamic time frame
This function is particularly useful if you wish to research events taking place over a long period. Click the round selection button next to the Dynamic time-frame heading. Click the arrow on the right to open a pull-down menu in which you can select the start (“from”) and end (“to”) of the desired time frame.
The map automatically updates to display the desired events.
- Fixed time-frame
This function is particularly useful if you wish to research events in the past or view events from a specific date. Click the round selection button next to the Fixed time-frame heading. Click the calendar symbol on the right to open a pull-down menu in which you can select the start (“from”) and end (“to”) of the desired time frame. You can select a specific time for a date.
Then click the Apply button at the bottom to display events for the defined time frame on the map.
“Internal information” filter
Use this filter to activate pre-defined parameters for events displayed on the map. These parameters include e.g. addresses, GPS positions, personal travel destinations, hotel addresses and personal bookings.
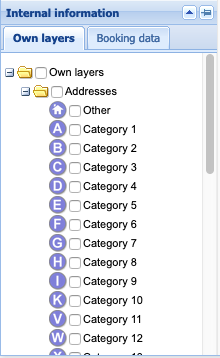
Fig.: “Internal information” filter
Tickers
The tickers on the right of the map provide a brief overview of current global events. Entries are displayed in chronological order in the windows by default and updated every minute.
Event ticker
This ticker displays the latest events in chart form. Events are listed in the order of updating, starting with the most recent update. The Update column shows the exact time of updating for an event.
The chart also displays the following information for each event:
- Event level (EL)
- Relevance level (RL)
- Event category
- Country
The Link column contains a link for each individual event. To find out more details about a specific event, click the “show” link for that event. An information window opens at the corresponding location on the map.
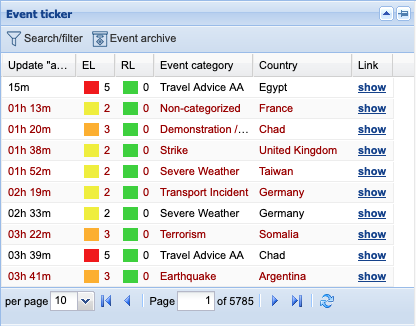
Fig.: Events ticker
“Travel Advice AA” ticker
This ticker shows the latest travel advice from the German Foreign Office (AA),which may include travel and safety advice, partial travel alerts and travel alerts. Events are listed in the order of updating, starting with the most recent update. The Update column shows the exact time of updating for an event.
The chart also displays the following information for each event:
- Status
- Country
The Link column contains a link for each individual event. To find out more details about a specific event, click the “show” link for that event. The corresponding website opens in a separate tab.
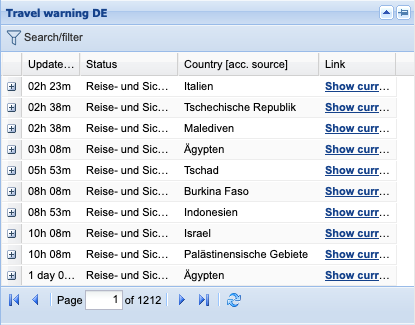
Fig.: “Travel Advice AA” ticker
To view travel advice for a specific country, click the plus sign on the far left of the corresponding line. An information window showing the desired advice opens in the ticker.
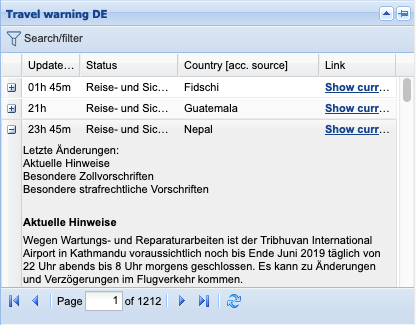
Fig.: Travel advice for a specific event
Use the sidebar on the far right of the text box to scroll down longer texts. Click (the minus sign) to close the window again.
This tutorial will show you how to make the settings in the warning system.